

In artificial intelligence, metrics are like a compass and a barometer, in a way that they indicate whether the model is heading in the right direction and how reliable it is. Imagine you are watching an athlete. Some people evaluate their time at the finish line, some their technique, and others the number of victories in a season. Each indicator reveals a different aspect of the truth, and only when they are considered together does a complete picture emerge/appear. The same is true for AI. A model can perform very well according to one measure and completely fail according to another one. This is why scientists have created a whole set of metrics to help tell the story of how an algorithm works in numbers, answering questions ranging from the simple ones, such as ‘Did it guess correctly?’, to the more complex ones, such as ‘Does it make sense?’ and ‘Did the hint come at the right moment?’.
So, how can we measure the intelligence of artificial intelligence?
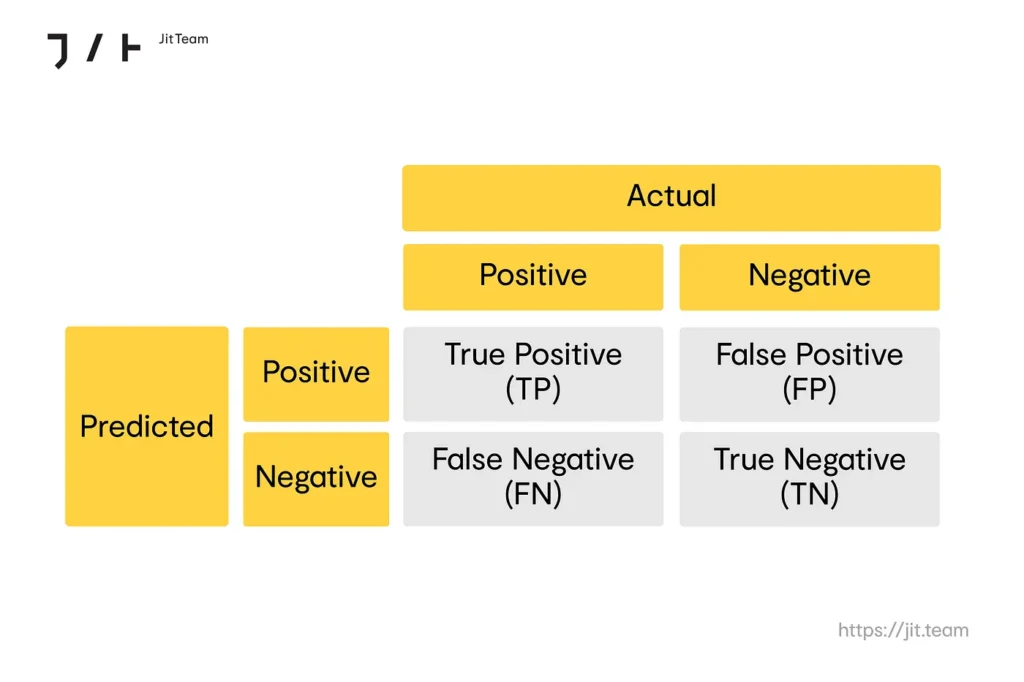
The easiest place to start is with classification systems that have to make a decision, such as identifying whether an image contains a cat or a dog, or whether an email is spam or not. First, it is worth looking at the four possible outcomes of a model: a hit (true positive), a miss due to oversight (false negative), a false alarm (false positive), and an accurate rejection (true negative). We can then take four metrics from these fields that tell us completely different things and are used in different situations, depending on what we care about.
Accuracy is the percentage of all correct decisions: (TP + TN)/(TP + FP + FN + TN), which can be misleading in rare cases. Let’s consider a system for detecting fraud in card payments. If 0.5% of transactions are fraudulent, a model that always classifies transactions as genuine has a 99.5% accuracy , but this does not protect any cardholder from theft. Accuracy is useful when the two categories are balanced, for example, in classifying review sentiment with a similar number of positive and negative reviews.
Precision asks: ‘How often are you right once you hear the alarm?’ TP/(TP + FP). In a spam filter, high precision means that important emails are rarely put in the “Spam” folder. In a facial recognition system that unlocks your phone, high precision means that you won’t let unauthorised people in. While it is inconvenient if the system sometimes fails to recognise the owner and does not unlock the phone (as you have to enter your PIN or try again), still no unauthorised person will access your data.
Recall, on the other hand, asks: ‘How many true cases did you miss?’ TP/(TP + FN). In mammography or gas leak detection, recall is paramount — oversights can have serious consequences. Content moderation systems also often prioritise recall: it’s better to catch most toxic posts, even if it means a few overzealous reports.
The F1 score attempts to reconcile the two concepts of precision and recall. It gives a lower score when either component is lacking, thus rewarding balance. When searching for company documents or automatically triaging helpdesk tickets, the F1 score accurately reflects ‘overall usefulness’ — we don’t want lots of irrelevant results (low precision) or important issues to be overlooked (low recall).
Here’s a micro-example in numbers using a spam filter: we have 1,000 emails, including 100 spam emails. The model marked 120 emails as spam, 90 of which were actually spam. Therefore, we have a precision of 90/120 = 0.75 (every fourth ‘alarm’ was unnecessary), a recall of 90/100 = 0.90 (we detected 90% of spam), an accuracy of (90 TP + 870 TN)/1000 = 0.96, and an F1 score of approximately 0.82. As you can see, the difference in emphasis demonstrates the following: while accuracy is important, it is only precision and recall that tell us whether the model is safe and useful.
Here’s a practical testing tip: the threshold acts like a slider that allows you to decide whether to prioritise catching as many cases as possible or avoiding false alarms. A stricter threshold results in fewer false alarms (higher precision), while a milder threshold results in fewer oversights (higher recall). Therefore, it is worth setting the threshold according to the business risk of a specific system. In other words, a good metric is not a formula in a vacuum, but an agreement between the model and the consequences of its errors.
The art of predicting numbers
When a model does not have to answer ‘yes/no’ but rather predicts a number — the price of an apartment, temperature, or stock price — regression comes into play. Here, the key question becomes: How wrong were we? MAE (mean absolute error) tells us how much the model missed on average. MSE (mean squared error) treats large errors more severely — just as a teacher would punish glaring mistakes more severely than some minor typos. R², on the other hand, assesses whether the model truly understands the variability of the data or is simply providing random answers.
When algorithms take on art
Things get even more interesting with generative models, which can write texts, create images, and compose music. But how can we measure the quality of a poem written by AI? Similarity metrics have been developed to address this question: ‘How close is the resemblance between what the machine has written and what a human has created?’.
The best-known metric is BLEU (Bilingual Evaluation Understudy). Originally created to evaluate machine translations, it is now used for various language tasks. BLEU examines how many n-grams (short sequences of words) overlap between the model text and the reference text. The more common the pieces, the higher the score. While this sounds reasonable, in practice it can be unreliable: if the model writes ‘The cat is sitting on the couch’ instead of ‘There is a cat sitting on the sofa’, BLEU will lower the score, even though both sentences mean the same thing.
This is where ROUGE (Recall-Oriented Understudy for Gisting Evaluation) steps in, looking at the overlap of fragments and asking, “Did the model catch the most important elements?”. ROUGE is popular for text summarisation because, when AI summarises an article, it is important that it identifies the key words and phrases. However, like BLEU, this metric only sees the surface. Two different words that mean the same thing may be considered an error.
This is why researchers sometimes consider perplexity, which is a measure of the model’s ‘confusion’. Imagine the model is predicting the next word in a sentence: ‘When I leave the house, I put on…’. If ‘shoes’ is the most statistically likely option, the perplexity will be low because the AI is confident in its prediction. However, if ‘umbrella’, ‘helmet’, or ‘duck’ appear among the candidates and the model hesitates, the score increases, indicating that it is unsure. Therefore, while a low perplexity value means fluency and consistency, it does not guarantee that the content makes sense. The model can produce nonsense with great confidence.
Numbers don’t tell the whole story
This is the crux of the problem: none of these metrics capture what is most important — style, irony, and wit. Testers who evaluate hundreds of generative AI responses say that sometimes it feels as though you’re dealing with a language virtuoso, while othertimes you encounter sentences that sound like excerpts from an internet forum from 20 years ago. Numbers help, but the final decision always rests with humans.